Building RevQ's first unified client dashboard.
A single-pane analytics portal that replaced manual, per-platform reporting for quick-commerce brands.


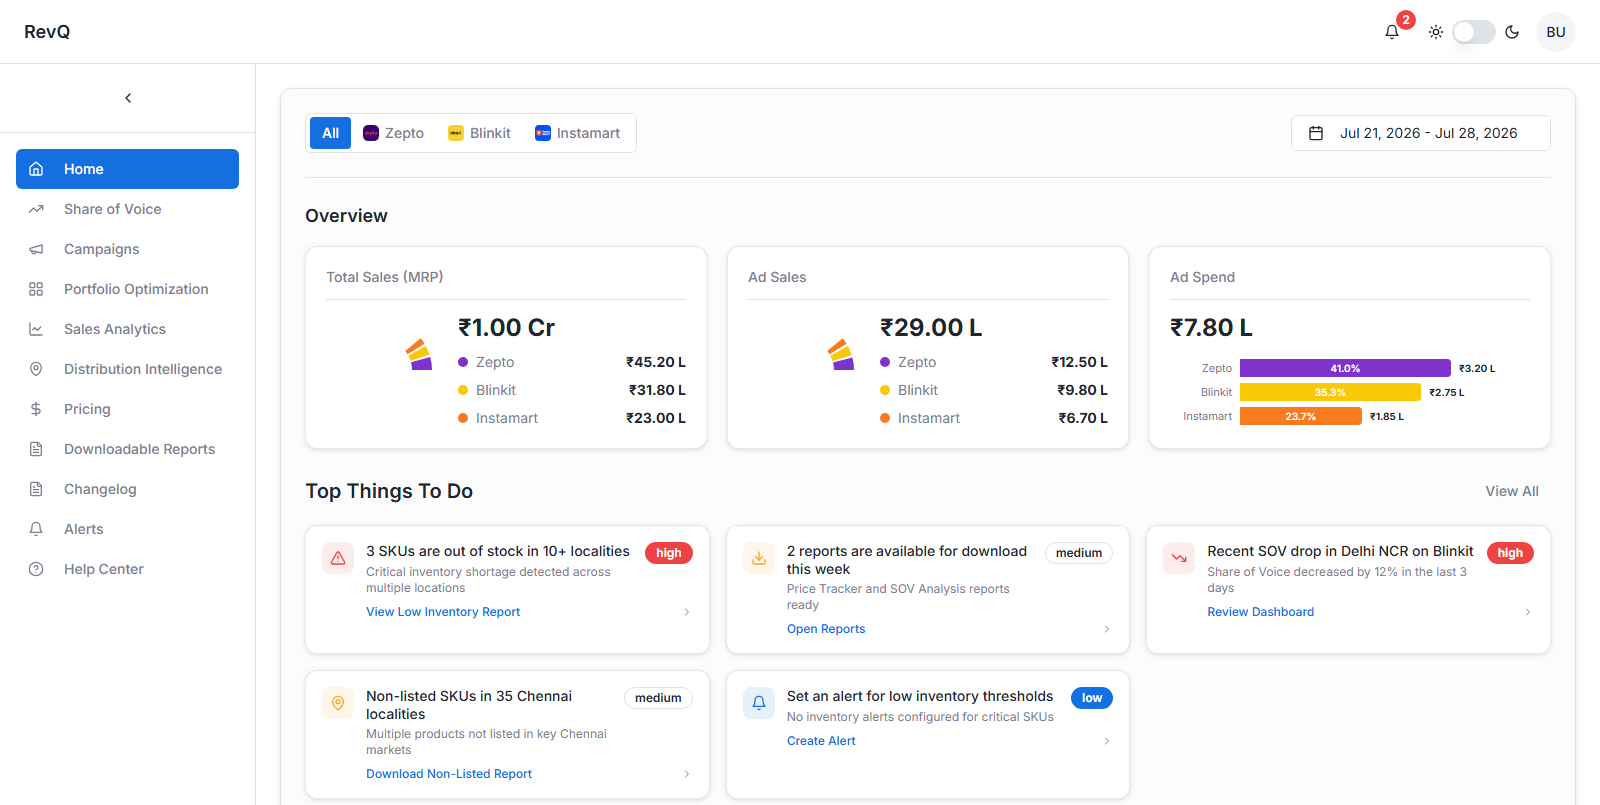
Initial prototype, built in Lovable (Aug 2025)
Best viewed on a laptop or desktop. Not yet optimized for mobile.
The Problem
Before this, RevQ's reports and features lived across different links with no single home. Clients, ranging from founders to quick-commerce teams at D2C brands listed on platforms like Blinkit, Zepto, Instamart, Amazon Now, and Flipkart Minutes, had to bookmark each of those different links, which made it harder to compare and view all of them in one place. As the number of reports and platforms grew, this became slower and harder to scale.
Reports and features lived across separate links with no single home.
An existing dashboard had real UI and functionality limits, and whatever didn't fit lived on separate links outside it.
As reports and platforms multiplied, the workflow got harder to sustain, not easier.
"What if clients never had to leave RevQ to get their data?"
The question that shaped the first prototype.
The Product Today
The prototype shaped the direction, but the product has evolved since. Here's a short walkthrough of what's actually live for clients today.
My Process
Started prototyping early
As one of RevQ's founding product team members, I started prototyping a solution in Lovable in August 2025.
Researched before designing
I researched how other client-facing e-commerce and quick-commerce dashboards were structured: what they surfaced first, why certain elements were placed where they were, and used that to shape an initial version.
Added features, got buy-in
I added features aimed specifically at making clients' day-to-day decisions faster, then took it to the founder for a first round of review.
Shipped with engineering
From there, I worked directly with the engineering team to prioritize what would ship first. Launch slipped to July 2026, mostly due to bandwidth on a small team, and because we had to prioritise the data infrastructure first. It's now live for all of RevQ's clients, with more features actively being worked on.
Key Decisions
Three decisions stand out because they came from watching clients use the product and sitting in on client meetings with the founder to understand where we could actually help more, not from assuming what they'd want.
Multi-tab comparison
- Clients kept switching between tabs to compare data, since most weren't technical enough to copy a URL into a new tab themselves.
- Added an "open in new tab" button on the most-visited views, so people could compare side by side without any extra effort.
Campaign recommendation system
- Mirroring ad-platform data on our portal wasn't enough, since clients still had to analyze it themselves.
- Built a recommendation layer that flags underperforming and under-funded campaigns, turning raw data into a clear next step.
Unified alerting
- Gave clients one place to manage all their alerts, so each person could choose exactly what they wanted to be notified about, and avoid being spammed.
- Also gave RevQ's team a single view of exactly which alerts each client or team had chosen.
Challenges & Tradeoffs
Data density created real load-time tradeoffs on some views, and technical complexity forced us to de-prioritize a few features for the first release rather than delay the launch further.
Outcome
The dashboard is live today and used by 20+ client brands. It replaced a fragmented, multi-login, manual-download workflow with a single login and a single place to compare performance across platforms, similar to how Skyscanner consolidates flights from multiple airlines instead of making you check each one separately.
"This has become my go-to place to get most of the important quick-comm data. I don't have to log into multiple platforms and pull reports anymore."
Founder, leading functional soda brand on Instamart and FirstClub